INDUSTRY
PropTech
I joined as the first and only designer, working with developers, the CTO, and CPO to rebuild CASAFARI’s app ecosystem. My role spanned research, design, prototyping, and branding for the company website and marketing materials. Being the only designer in this fast-paced startup, I learned many valuable lessons. Most importantly, how to collaborate closely with founders, stakeholders, and engineers to build the best product possible.
Role
Duration
September 2019 - November 2020
Lead Product Designer
Modernizing PropTech: Data Platform Redesign
Modernizing PropTech: Data Platform Redesign
I joined as the first and only designer, working with developers, the CTO, and CPO to rebuild CASAFARI’s app ecosystem. My role spanned research, design, prototyping, and branding for the company website and marketing materials. Being the only designer in this fast-paced startup, I learned many valuable lessons. Most importantly, how to collaborate closely with founders, stakeholders, and engineers to build the best product possible.
INDUSTRY
PropTech
Role
Duration
Lead Product Designer
September 2019 - November 2020
%
10
CRR
%
15
NPS
Objectives exceeded 🏅
Outcome
Objectives
Location on Map
%
7
MRR
%
15
CSAT
Objectives exceeded 🏅
Outcome
Objectives
Property Details
%
10
CRR
%
50
CER
Objectives achieved ✅
Outcome
Objectives
Search Input Update
Customer Satisfaction Score
Net Promoter Score
Customer Retention Rate
Click Efficiency Rate
Customer Retention Rate
Monthly Recurring Revenue
%
5
CRR
%
25
TTCR
Objectives achieved ✅
Outcome
Objectives
Filtering & Sorting Enhancement
Time to Task Completion Rate
Customer Retention Rate
Customer Satisfaction Score
Net Promoter Score
Customer Retention Rate
Click Efficiency Rate
Customer Retention Rate
Monthly Recurring Revenue
Time to Task Completion Rate
Customer Retention Rate
%
10
CRR
%
15
NPS
Objectives exceeded 🏅
Outcome
Objectives
Location on Map
%
7
MRR
%
15
CSAT
Objectives exceeded 🏅
Outcome
Objectives
Property Details
%
10
CRR
%
50
CER
Objectives achieved ✅
Outcome
Objectives
Search Input Update
%
5
CRR
%
25
TTCR
Objectives achieved ✅
Outcome
Objectives
Filtering & Sorting Enhancement
Figma
Desktop
Data visualization
Usability & A/B Testing
JTBD
CJMs
Google Analytics
CrazyEgg
Hotjar
Surveys & Questionnaires
Interviews
Project Tags
The main goal was to explore ways to bridge the gap between the cluttered existing features and a unified, simplified version—without disrupting user habits or behavioral patterns. As well as establish a consistent visual identity and guidelines for current and future developments. We sought to avoid drastic interface changes that could introduce additional friction during onboarding or product usage, as well as increased development costs for the company.
Finding an efficient solution that balanced both customer needs and business goals proved to be an interesting and rewarding challenge.
Finding an efficient solution that balanced both customer needs and business goals proved to be an interesting and rewarding challenge.
Design Challenge
CASAFARI is the pioneering, cleanest, and largest real estate database in Europe – powered by AI. It enables and accelerates deals with unique data insights.
When I joined CASAFARI, the company had three products and was rapidly expanding its customer base. However, many solutions had been developed based on custom requests from clients, leading to a cluttered product with numerous features that were difficult to use and scale. Additionally, the brand was significantly weaker compared to competitors. These factors led to low customer trust, high acquisition costs, and intensive onboarding and support needs, hindering scalability and efficiency.
When I joined CASAFARI, the company had three products and was rapidly expanding its customer base. However, many solutions had been developed based on custom requests from clients, leading to a cluttered product with numerous features that were difficult to use and scale. Additionally, the brand was significantly weaker compared to competitors. These factors led to low customer trust, high acquisition costs, and intensive onboarding and support needs, hindering scalability and efficiency.
Team & Stakeholders
For this project, I had to continuously communicate with my stakeholders to update them on my progress as well as be proactive in seeking out feedback. The team consisted of 2 Product Managers, 1 Product Designer, 4 Software Engineers and 1 QA. I received product and customer insights from weekly critiques with CPO Mila Suharev, and CTO Mitya Moskalchuk. I checked in with software engineers Andrey Yasenov, Andrii Tsapenko, full-stack developer Roman Zadvorniy, FE developer Bohdan Tymhenko, and QA lead Tetiana Fomychova for engineering feedback to identify any limitations or restrictions and propose solutions to any roadblocks.
About the Company
Context
Project Tags
The main goal was to explore ways to bridge the gap between the cluttered existing features and a unified, simplified version—without disrupting user habits or behavioral patterns. As well as establish a consistent visual identity and guidelines for current and future developments. We sought to avoid drastic interface changes that could introduce additional friction during onboarding or product usage, as well as increased development costs for the company.
Finding an efficient solution that balanced both customer needs and business goals proved to be an interesting and rewarding challenge.
Finding an efficient solution that balanced both customer needs and business goals proved to be an interesting and rewarding challenge.
Design Challenge
CASAFARI is the pioneering, cleanest, and largest real estate database in Europe – powered by AI. It enables and accelerates deals with unique data insights.
When I joined CASAFARI, the company had three products and was rapidly expanding its customer base. However, many solutions had been developed based on custom requests from clients, leading to a cluttered product with numerous features that were difficult to use and scale. Additionally, the brand was significantly weaker compared to competitors. These factors led to low customer trust, high acquisition costs, and intensive onboarding and support needs, hindering scalability and efficiency.
When I joined CASAFARI, the company had three products and was rapidly expanding its customer base. However, many solutions had been developed based on custom requests from clients, leading to a cluttered product with numerous features that were difficult to use and scale. Additionally, the brand was significantly weaker compared to competitors. These factors led to low customer trust, high acquisition costs, and intensive onboarding and support needs, hindering scalability and efficiency.
Team & Stakeholders
About the Company
Context
Figma
Desktop
Data visualization
Usability & A/B Testing
JTBD
CJMs
Google Analytics
CrazyEgg
Hotjar
Surveys & Questionnaires
Interviews
For this project, I had to continuously communicate with my stakeholders to update them on my progress as well as be proactive in seeking out feedback. The team consisted of 2 Product Managers, 1 Product Designer, 4 Software Engineers and 1 QA. I received product and customer insights from weekly critiques with CPO Mila Suharev, and CTO Mitya Moskalchuk. I checked in with software engineers Andrey Yasenov, Andrii Tsapenko, full-stack developer Roman Zadvorniy, FE developer Bohdan Tymhenko, and QA lead Tetiana Fomychova for engineering feedback to identify any limitations or restrictions and propose solutions to any roadblocks.
👉 In-depth interviews
To get to know our customers better, their needs, pains and validate these hypotheses, I conducted interviews with customers from different segments and markets - PT, ES, and IT. Having answers to these questions also allowed the team to focus on key interactions that would delight the end user based on quantitative and qualitative data.
To get to know our customers better, their needs, pains and validate these hypotheses, I conducted interviews with customers from different segments and markets - PT, ES, and IT. Having answers to these questions also allowed the team to focus on key interactions that would delight the end user based on quantitative and qualitative data.
Research
CPO, CTO, COO, Sales and Customer Success team leaders from each market (PT, ES, IT), and a few best-performing sales, account executives, and customer success representatives.
👉 Gain insights into existing UX bottlenecks and issues
An analysis of product usage data provided insights into the efficiency of current solutions. By conducting additional surveys and questionnaires and performing competitor analysis, we got a deeper understanding of context for our design-thinking meetings and gathered enough data to clearly identify UX bottlenecks. These insights also informed future developments aimed at delivering a more complete and satisfying customer experience.
An analysis of product usage data provided insights into the efficiency of current solutions. By conducting additional surveys and questionnaires and performing competitor analysis, we got a deeper understanding of context for our design-thinking meetings and gathered enough data to clearly identify UX bottlenecks. These insights also informed future developments aimed at delivering a more complete and satisfying customer experience.
Tools used
🔥 HotJar & CrazyEgg recordings – To identify hotspots and potential workflow issues
👁️ Clicks & Pageviews analysis – To measure feature usage
🃏 Card Sorting – To assess the relevance of filters
👍 Customer Satisfaction Score (CSAT) – To gauge user satisfaction
🔥 HotJar & CrazyEgg recordings – To identify hotspots and potential workflow issues
👁️ Clicks & Pageviews analysis – To measure feature usage
🃏 Card Sorting – To assess the relevance of filters
👍 Customer Satisfaction Score (CSAT) – To gauge user satisfaction
👉 Identify customer personas and key use cases
To start the research process, I first engaged with internal stakeholders and key team members to gather information about existing user types and primary product use cases. It became clear that the team has adopted the practice of differentiating clients by type and size of business, based on sales-led principle.
To start the research process, I first engaged with internal stakeholders and key team members to gather information about existing user types and primary product use cases. It became clear that the team has adopted the practice of differentiating clients by type and size of business, based on sales-led principle.
"
What are the top 3 tasks you spend the most time on?
"
Are there any repetitive or manual tasks you wish could be automated?
"
How satisfied are you with your current tools or solutions? Why?
"
Are there other challenges we haven’t discussed that affect your work?
"
Could you describe your typical day at work and the key tasks you focus on?
"
What slows you down or complicates your workflow at the moment?
"
Can you share examples where a tool or process didn’t work as expected?
"
Have you had to create workarounds to solve problems with your current tools?
Goals & Synthesis
👉 In-depth interviews
To get to know our customers better, their needs, pains and validate these hypotheses, I conducted interviews with customers from different segments and markets - PT, ES, and IT. Having answers to these questions also allowed the team to focus on key interactions that would delight the end user based on quantitative and qualitative data.
To get to know our customers better, their needs, pains and validate these hypotheses, I conducted interviews with customers from different segments and markets - PT, ES, and IT. Having answers to these questions also allowed the team to focus on key interactions that would delight the end user based on quantitative and qualitative data.
Research
CPO, CTO, COO, Sales and Customer Success team leaders from each market (PT, ES, IT), and a few best-performing sales, account executives, and customer success representatives.
👉 Gain insights into existing UX bottlenecks and issues
An analysis of product usage data provided insights into the efficiency of current solutions. By conducting additional surveys and questionnaires and performing competitor analysis, we got a deeper understanding of context for our design-thinking meetings and gathered enough data to clearly identify UX bottlenecks. These insights also informed future developments aimed at delivering a more complete and satisfying customer experience.
An analysis of product usage data provided insights into the efficiency of current solutions. By conducting additional surveys and questionnaires and performing competitor analysis, we got a deeper understanding of context for our design-thinking meetings and gathered enough data to clearly identify UX bottlenecks. These insights also informed future developments aimed at delivering a more complete and satisfying customer experience.
Tools used
🔥 HotJar & CrazyEgg recordings – To identify hotspots and potential workflow issues
👁️ Clicks & Pageviews analysis – To measure feature usage
🃏 Card Sorting – To assess the relevance of filters
👍 Customer Satisfaction Score (CSAT) – To gauge user satisfaction
🔥 HotJar & CrazyEgg recordings – To identify hotspots and potential workflow issues
👁️ Clicks & Pageviews analysis – To measure feature usage
🃏 Card Sorting – To assess the relevance of filters
👍 Customer Satisfaction Score (CSAT) – To gauge user satisfaction
👉 Identify customer personas and use cases
To start the research process, I first engaged with internal stakeholders and key team members to gather information about existing user types and primary product use cases. It became clear that the team has adopted the practice of differentiating clients by type and size of business, based on sales-led principle.
To start the research process, I first engaged with internal stakeholders and key team members to gather information about existing user types and primary product use cases. It became clear that the team has adopted the practice of differentiating clients by type and size of business, based on sales-led principle.
"
What are the top 3 tasks you spend the most time on?
"
Are there any repetitive or manual tasks you wish could be automated?
"
How satisfied are you with your current tools or solutions? Why?
"
Are there other challenges we haven’t discussed that affect your work?
"
Could you describe your typical day at work and the key tasks you focus on?
"
What slows you down or complicates your workflow at the moment?
Can you share examples where a tool or process didn’t work as expected?
"
Have you had to create workarounds to solve problems with your current tools?
Goals & Synthesis
"
Codebase Complexity
- Excessive CSS layers and redundant code, leading to slow development and inconsistent UI
Missing Core Features and Data Points
- No property image gallery and map search function
- Some unavailable key property details
Overloaded Filters and Complicated Search Flows
- Filters difficult to navigate and excessive in number
- Too lengthy search process, with unnecessary steps
Cluttered and Inconsistent UI
- Disorganized interface with excessive information
- Lack of consistent design patterns and component styles
🚨 Identified Areas For Improvement
Challenge
How I Overcame It
Lack of Product Usage Data
I utilized tools like Google Analytics, Hotjar, and Crazy Egg to get additional data, track user behavior and identify patterns. By combining quantitative data with qualitative insights from customer interviews, we were able to create a more comprehensive view of the issues.
Challenge
How I Overcame It
No Clear Persona Types or Use Cases
The existing segmentation was solely based on business size and revenue contribution. To address this, I conducted in-depth customer research, developed detailed personas, and mapped out their key use cases. This approach allowed us to identify shared pain points and better tailor product solutions.
I conducted follow-up interviews and surveys with a wider variety of customers, including different user personas and technical stakeholders. This helped to fill in gaps and validate the feedback.
Challenge
How I Overcame It
Incomplete Customer Feedback
During the research process, we encountered several challenges that required careful consideration and problem-solving:
Key Observations & Outcomes
I identified the need for a scalable design system to enhance efficiency and ensure visual consistency. We initiated a cleanup of the codebase, standardized components, and laid the foundation for the company's first design system.
Challenge
How I Overcame It
Cluttered Codebase
Challenge
How I Overcame It
Lack of Product Usage Data
I utilized tools like Google Analytics, Hotjar, and Crazy Egg to get additional data, track user behavior and identify patterns. By combining quantitative data with qualitative insights from customer interviews, we were able to create a more comprehensive view of the issues.
Challenge
How I Overcame It
No Clear Persona Types or Use Cases
The existing segmentation was solely based on business size and revenue contribution. To address this, I conducted in-depth customer research, developed detailed personas, and mapped out their key use cases. This approach allowed us to identify shared pain points and better tailor product solutions.
I conducted follow-up interviews and surveys with a wider variety of customers, including different user personas and technical stakeholders. This helped to fill in gaps and validate the feedback.
Challenge
How I Overcame It
Incomplete Customer Feedback
During the research process, we encountered several challenges that required careful consideration and problem-solving:
Key Observations & Outcomes
I identified the need for a scalable design system to enhance efficiency and ensure visual consistency. We initiated a cleanup of the codebase, standardized components, and laid the foundation for the company's first design system.
Challenge
How I Overcame It
Cluttered Codebase
Ideation & Validation
Ideation & Validation
The property search experience was streamlined by consolidating multiple starting points into a single, centralized input. Previously, users had to navigate various sections across the page to initiate a search. Now, with one unified search bar, the process is faster and requires fewer steps. Additionally, the visual contrast of the bar and the Search button was enhanced, making them more prominent and easier to locate. These changes allow users to begin their property search more efficiently and with less effort.
Simplified Property Search Experience
Minimizing the amount of steps to get a job done requires a deep understanding of user behavior, market research, and operating system limitations. Providing a few property details resulted in overly broad search results while applying too many filters limited potentially interesting opportunities. While prioritising search parameters and filters, we looked for easy ways to delight the users, with data models and engineering legacy limitations in mind.
Filter Optimization
While other competitors highlight only a fraction of available not deduplicated property data points, CASAFARI is built on the most comprehensive and cleanest real estate database. It provides users with a complete property overview, including a gallery of pictures, time on the market, and a history of all changes. This approach not only simplifies the search process but also enables users to gain deeper insights and stay ahead of the competition within seconds.
Enhanced Data Visualization
Finally, high-fidelity prototypes & user testing sessions
- to provide a realistic experience and observe interactions
- to identify usability issues and make final adjustment
Next, A/B testing
- to evaluate the visibility and impact of key features
- to compare variations we identified as the most effective
First, low-fidelity prototypes
- to quickly visualize ideas and gather early feedback
- to understand user expectations and refine the design
Ideas Validation
In our project, we adopted a thorough ideas validation process to ensure the effectiveness of new features before development. This iterative approach allowed us to validate design ideas effectively, minimizing risks and ensuring a user-centered solution before moving into development.
Challenge
How I Overcame It
Data Issues in MongoDB and Missing Data Models
I worked with the BI team to retrieve missing data in account settings, improving customer data accuracy and user experience. By highlighting issues to the CPO and CTO, I secured high-priority fixes. I also collaborated with data and development teams to train new models for filters, addressing challenges early to prioritize development and ensure timely delivery.
Different filter sets in each product led to friction when users switched between products. I initiated the standardization of filters across the entire product ecosystem. By defining reusable design patterns and collaborating closely with developers, we ensured consistent filtering behavior, improving user experience and reducing cognitive load.
Challenge
How I Overcame It
Inconsistent Filter Menus Across Products
In the process of the Ideation & Validation, we found several bottlenecks that required consideration and after discussion led the team to a few important insights:
The cluttered codebase made UI updates resource-intensive. I proposed incremental updates using a scalable design system, implemented gradually by product and page. This approach reduced resource demands and improved visual consistency without disrupting the user experience.
Challenge
How I Overcame It
Beginning of Design System Development
Challenges
Challenge
How I Overcame It
No Ability to Show All Properties on the Map
Pagination and spatial aggregation issues made it difficult to display all properties on the map. I collaborated with the development team to redesign data loading strategies, enabling efficient spatial aggregation while minimizing performance issues. This allowed users to visualize all relevant properties on the map seamlessly.
Challenge
How I Overcame It
Data Issues in MongoDB and Missing Data Models
I worked with the BI team to retrieve missing data in account settings, improving customer data accuracy and user experience. By highlighting issues to the CPO and CTO, I secured high-priority fixes. I also collaborated with data and development teams to train new models for filters, addressing challenges early to prioritize development and ensure timely delivery.
Different filter sets in each product led to friction when users switched between products. I initiated the standardization of filters across the entire product ecosystem. By defining reusable design patterns and collaborating closely with developers, we ensured consistent filtering behavior, improving user experience and reducing cognitive load.
Challenge
How I Overcame It
Inconsistent Filter Menus Across Products
In the process of the Ideation & Validation, we found several bottlenecks that required consideration and after discussion led the team to a few important insights:
The cluttered codebase made UI updates resource-intensive. I proposed incremental updates using a scalable design system, implemented gradually by product and page. This approach reduced resource demands and improved visual consistency without disrupting the user experience.
Challenge
How I Overcame It
Beginning of Design System Development
Challenges
Challenge
How I Overcame It
No Ability to Show All Properties on the Map
Pagination and spatial aggregation issues made it difficult to display all properties on the map. I collaborated with the development team to redesign data loading strategies, enabling efficient spatial aggregation while minimizing performance issues. This allowed users to visualize all relevant properties on the map seamlessly.
Design & Development
Design & Development
Search by location, reference number, the new “Search by Address,” and “Previous Searches” features were combined into a single search bar with increased priority and visibility on the page. This streamlined and simplified the search experience across all products, resulting in a 2x reduction in the time required for new searches and a 3x faster process for finding relevant opportunities.
New bar with enhanced input options
Search Update
*picture sourced by CASAFARI.COM
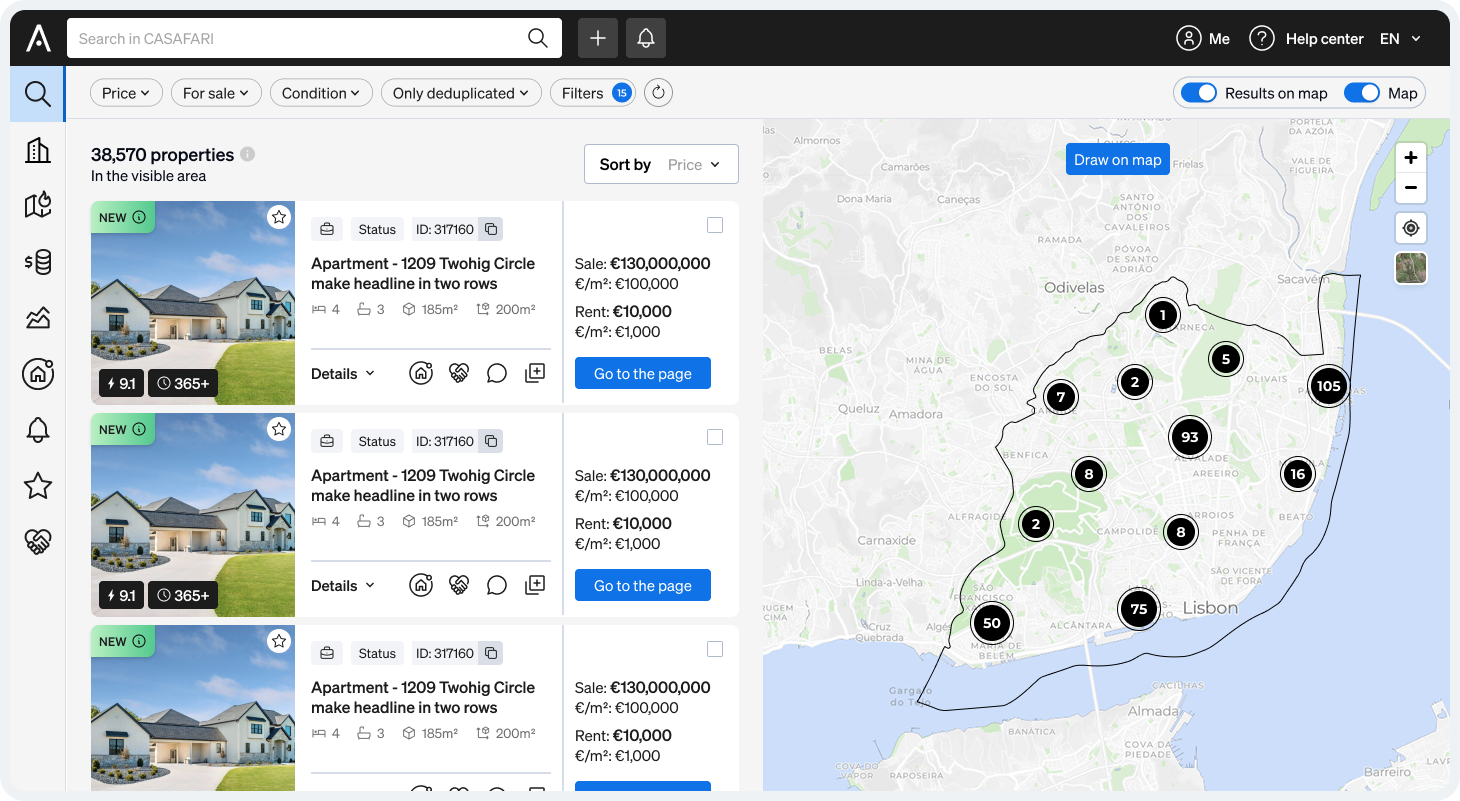
Displaying properties on the map allowed users to reduce the time needed to narrow down and filter relevant properties, better meeting their clients' requirements. By visualizing areas adjacent to the search zone, users could now discover new opportunities that would otherwise be removed from search results after applying filters. These improvements, combined with other changes, contributed to a 25% increase in product satisfaction scores.
Clear visibility of property location
New Map Feature
*picture sourced by CASAFARI.COM
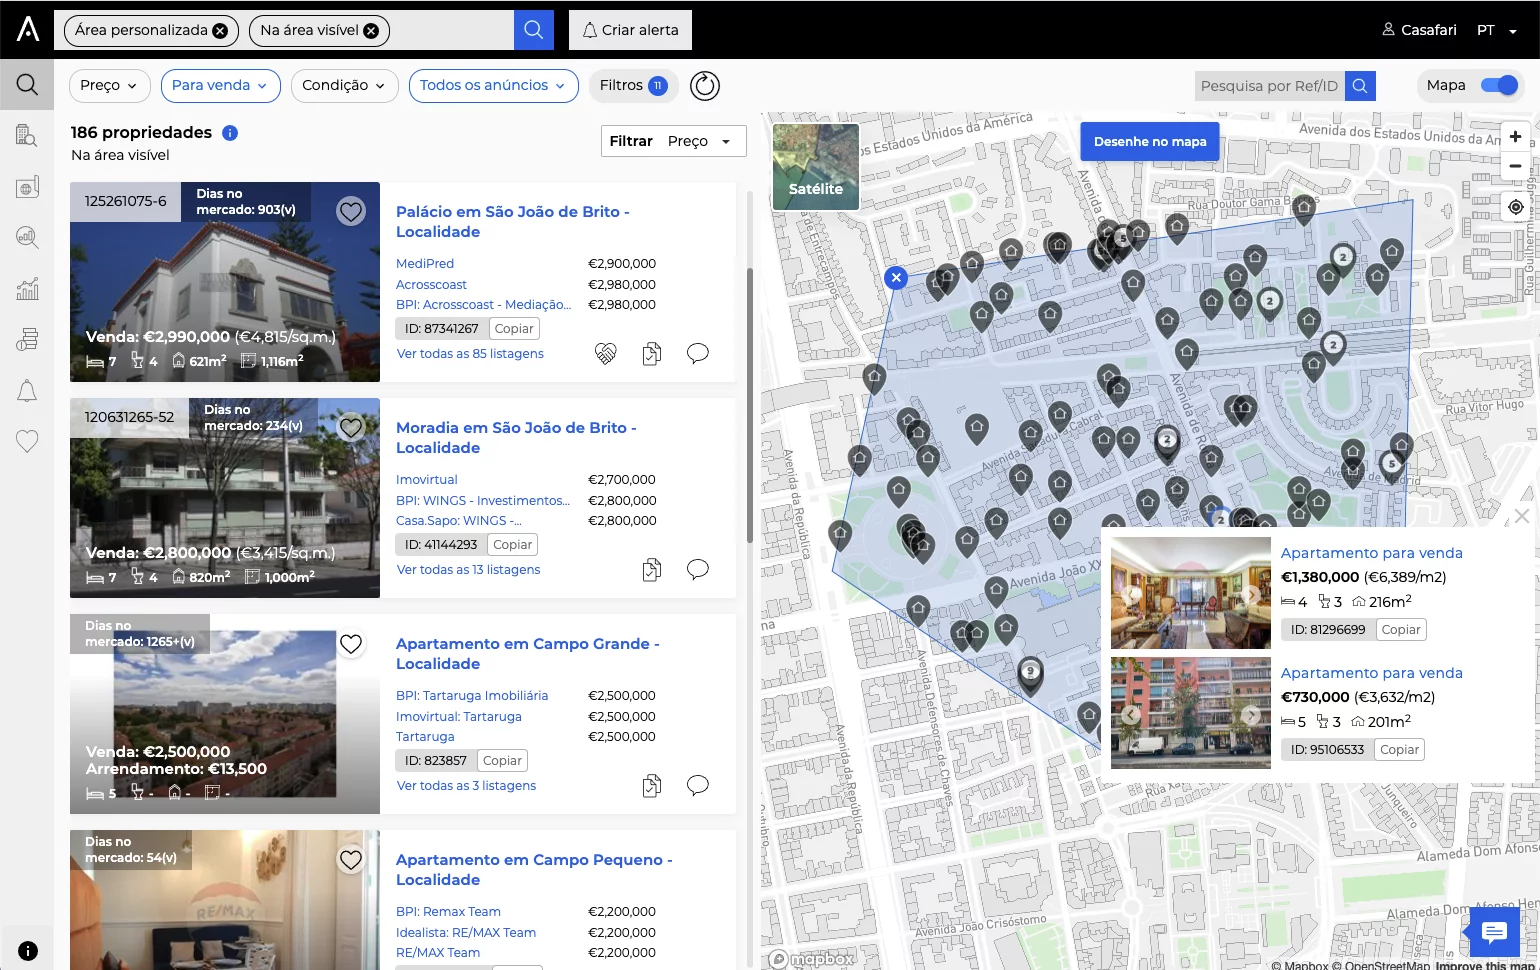
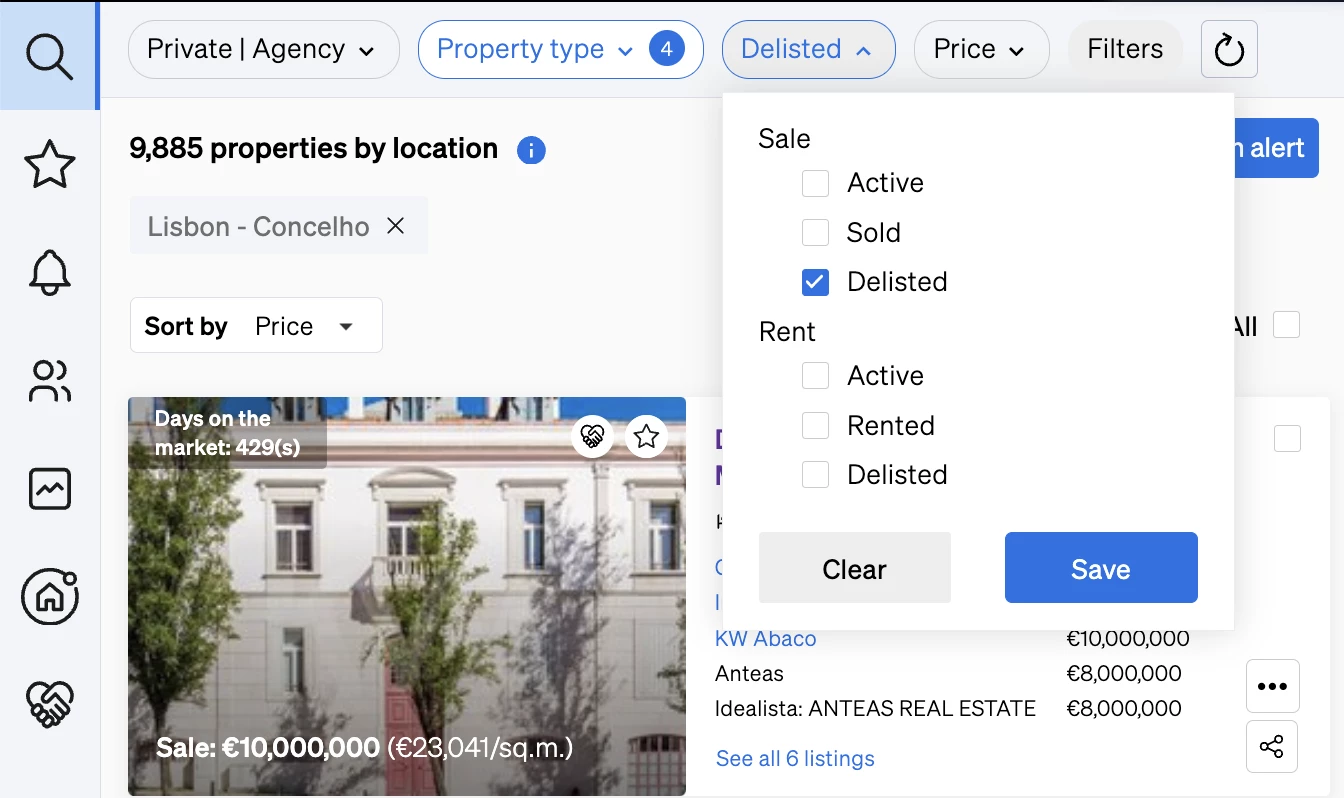
Positioning frequently used filters at the top and grouping others by relevance made it easier to define property characteristics and quickly narrow down results. Extended sorting options highlighted key properties, reducing search time by 3x and doubling favorites.
Highlighting the Most Relevant Properties
Unified Filters & Extended Sorting
*picture sourced by CASAFARI.COM
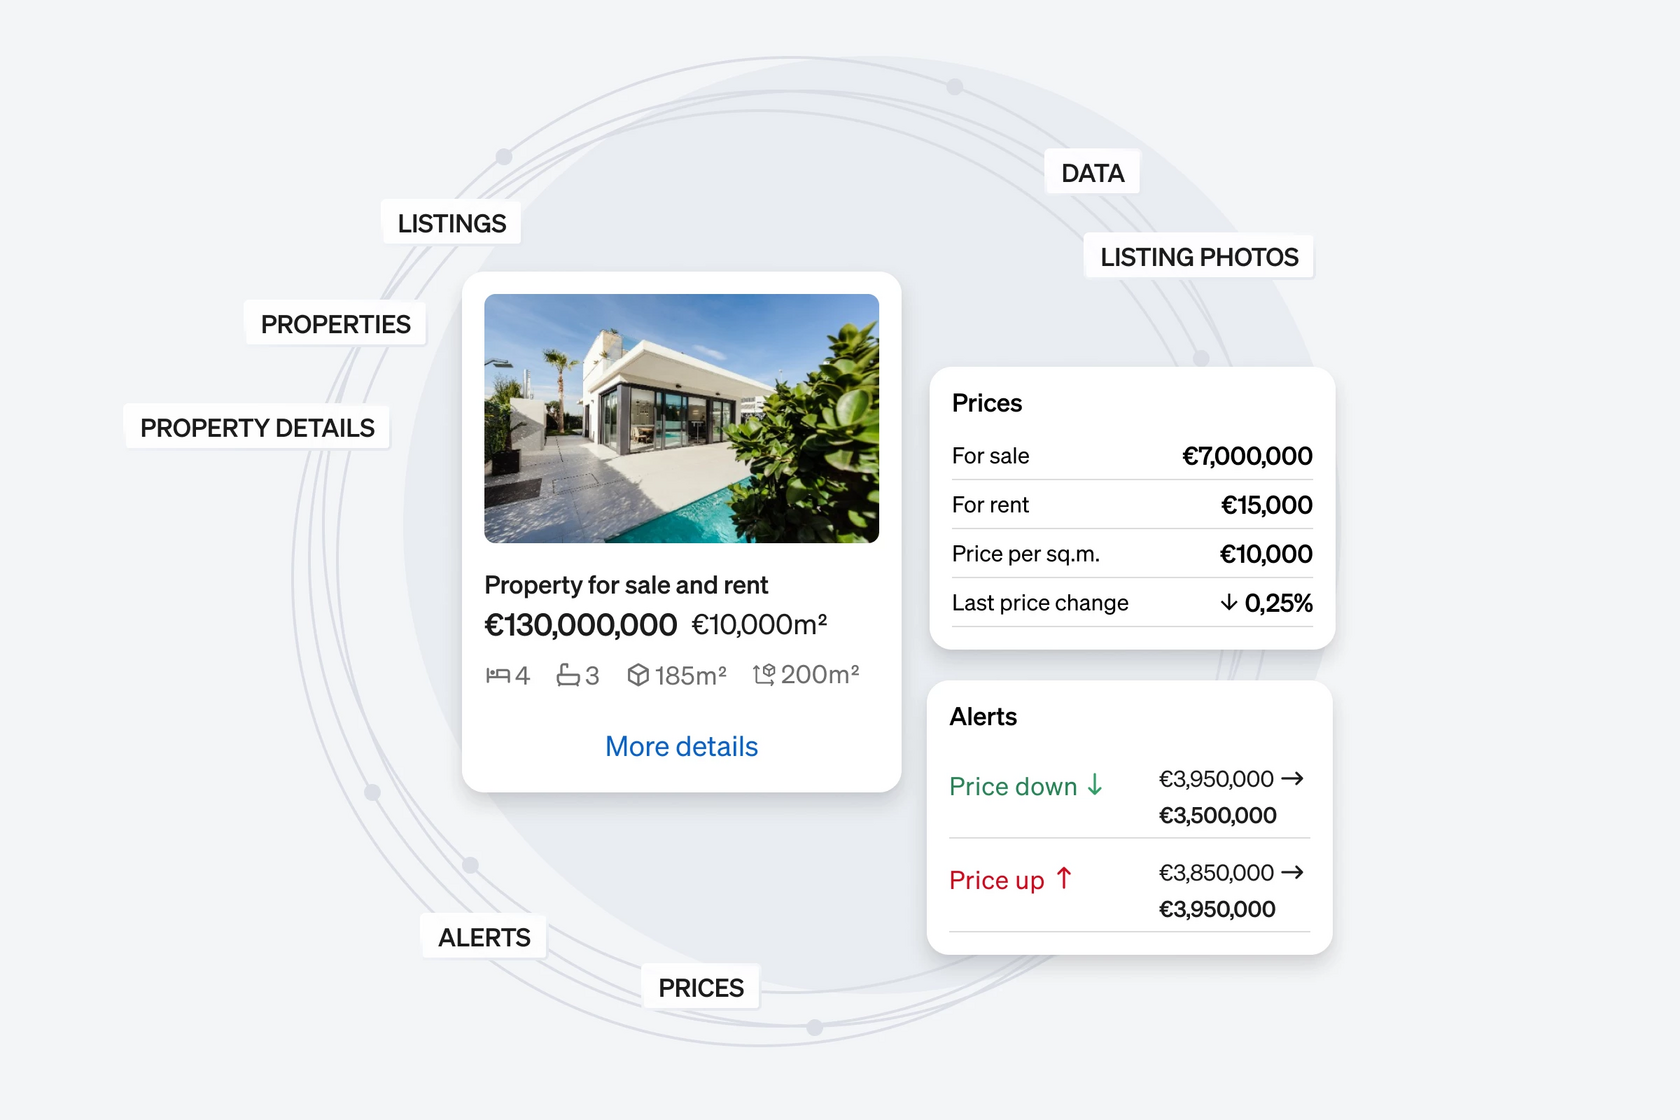
Adding more property pictures and crucial data points enabled users to make more informed property proposals to their clients. With a complete and visually appealing property overview, users gained more credibility and influence in guiding their clients' decisions. This led to a 30% increase in the number of shared properties and generated property PDF reports.
Better credibility and informed decisions
Exhaustive Property Data
*picture sourced by CASAFARI.COM
Adding more property pictures and crucial data points enabled users to make more informed property proposals to their clients. With a complete and visually appealing property overview, users gained more credibility and influence in guiding their clients' decisions. This led to a 30% increase in the number of shared properties and generated property PDF reports.
Better credibility and informed decisions
Exhaustive Property Data
"Redesigning an ecosystem of products and its user experience can be overwhelming for one designer. Staying at the cutting edge required persistence and relentlessness from me and the team. Fortunately, the founders fostered a culture of brutally honest communication, enabling us to create, test, and learn rapidly with high engagement."
Results & Impact
I worked with some of the most dedicated people I've ever worked with on this project. The engineers worked day and night to build a product that functioned well. As the only designer on the team, it is my humble opinion that what we did best was, lazer focus communication in every meeting to provide the best solutions and align priorities to put our efforts in the right areas. I primarily worked closely with CPO and CTO and Lead engineer sit side by side to ensure that the designs are not only creative, beautiful and viable for the business but also feasible for the engineering team to build. Having trust in the team was also very helpful during the rough times. I didn't know how we were going to do it with such tight deadlines, but we had a "get it done" culture and a strong motivation to do it well that really helped keep everyone focused.
What we did well 😊
When I joined the team, my main goal was to quickly understand customer needs, motivations, and pain points. I held numerous meetings with the CPO and CTO to clarify product and data-flow specifications. In hindsight, I would have placed greater emphasis on understanding software limitations to ensure scalable, reusable designs across products. Some feature transitions, data points, and filters were excluded from the initial build due to legacy code issues impacting performance. Additionally, as a fast-growing startup, documenting PRDs and the reasons behind changes was often overlooked for quick delivery. At times, I prioritized delivery and ease of implementation over building a foundation for future iterations. Working in a fast-paced environment requires balancing delivery with strategic long-term planning, and I wish I had voiced this need more often.
What I would do differently 🤔
THAT'S A MATCH?
GET IN TOUCH!
GET IN TOUCH!
I am ready to travel to work with week- or months-long projects.

